
Electrical Resistivity Tomography
Map subsurface resistivity variation to investigate geological and engineering ground conditions.
Imaging resistivity variation beneath the surface.
Electrical Resistivity Tomography is a geophysical method that measures electrical resistivity variations within the subsurface. The resulting two-dimensional interpretation can provide information about changes in subsurface materials and conditions.
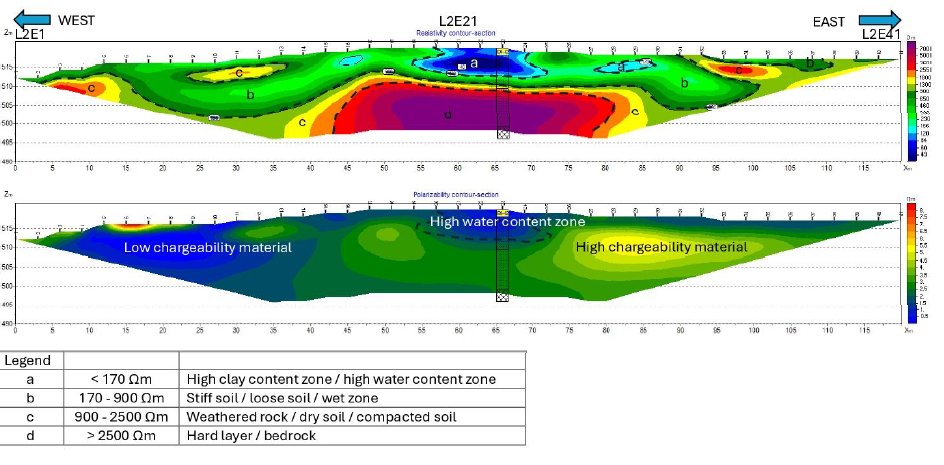
Depending on site conditions.
- Soil and weathered material variation
- Bedrock profile
- Potential groundwater zones
- Fractured zones
- Weak or disturbed zones
- Potential cavities
- Buried geological features
ERT results are interpreted together with geological information and other available evidence.
Six steps from design to reporting.
Survey Design
Define objectives, survey geometry and investigation coverage.
Data Acquisition
Acquire resistivity measurements along planned survey lines.
Quality Control
Review measurement quality and remove unsuitable data where justified.
Inversion
Process the dataset to obtain a subsurface resistivity model.
Geological Interpretation
Relate resistivity contrasts to geological and engineering conditions.
Reporting
Present profiles, interpretation and relevant limitations.
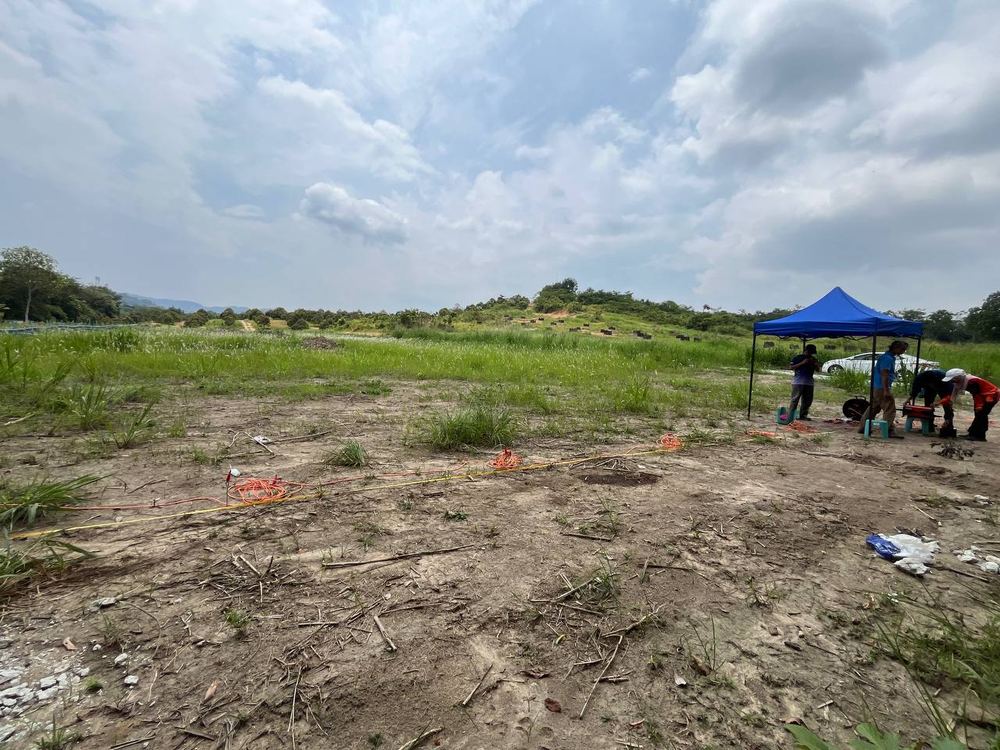
Open-Area Survey
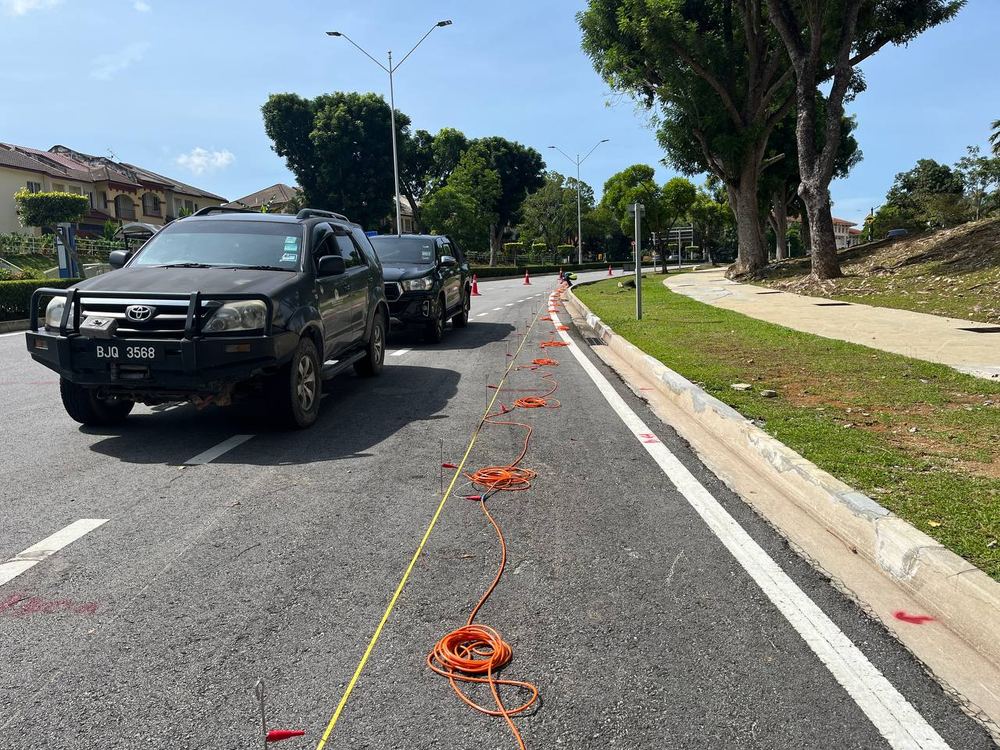
Roadside Survey
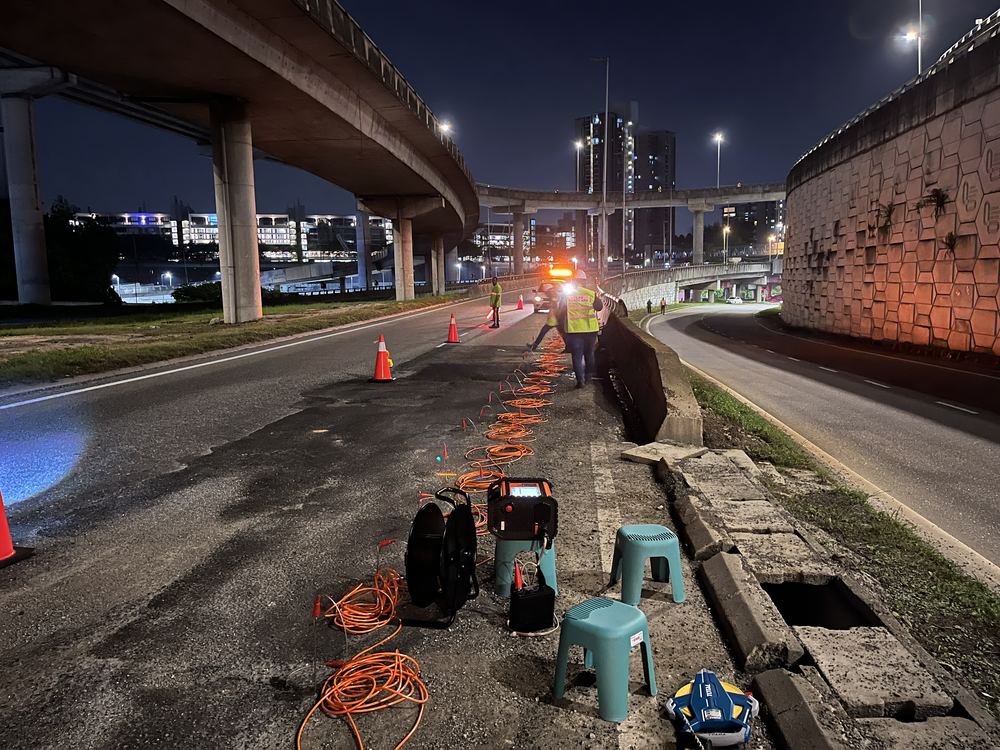
Night Highway Survey
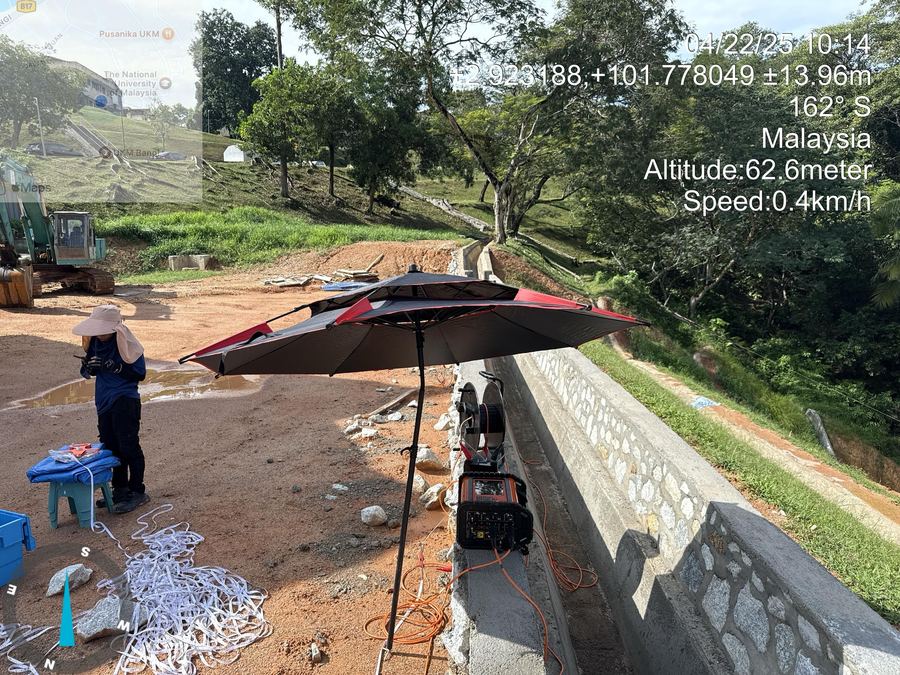
Bangi, Selangor
Important interpretation note: resistivity is not a direct geological classification.
Similar resistivity values can occur in different materials, while the same geological material can show different resistivity values depending on moisture, porosity, clay content, saturation and other factors. Geological context and verification data remain important.
Request an ERT proposal.
Tell us the ground condition you need to understand and we'll propose an appropriate survey design.